Overview
Due to the burgeoning of machine learning and artificial intelligence technology, it may feel as though there are eyes perpetually watching us. It is undeniable that, whether it is through surveillance cameras, phones, or desktops, we are always exposed to being analyzed by merely living our everyday lives. The most frightening part about this phenomenon is that most people are unaware of what is actually being seen and how. As our society begins to yield more responsibility and credibility to image analysis and other machine learning software, it is important to educate the public so that we collectively make informed decisions about them. Our interactive web application conducts facial analysis and utilizes explainable artificial intelligence (XAI) to aid in communicating the inner-workings of the machine learning "black box." In addition, we discuss the importance of model fairness, role of XAI in ensuring fairness, and potential discriminatory practices that stem from the imprudent use of machine learning.
Why Facial Analysis?
Since the primary goal of our project is to educate the public, we wanted to choose a topic that is personal and relatable. Facial analysis fits those requirements well because (1) a person's face reveals the foundation of their lived experiences (especially in diverse countries such as the US) and (2) facial analysis technology has become entrenched in our society. In addition, facial analysis technology is a major ethnical point of contention when discussing image processing. The stakes are especially high in machine learning for facial analysis due to the terrible, discriminatory consequences that may ensue if the technology is not trained judiciously. By conducting facial analysis, we were able to discuss many tangential societal issues, such as privacy and bias in the criminal justice system, in our demonstration of bias model performance.
What is Explainable AI (XAI)?
XAI is a tool to improve the model explainability by visually showing what parts of our input face image our custom trained model is focusing on when making its predictions/classifications. We used the Grad-CAM and Integrated Gradients (IG) algorithms to generate class discriminative heatmaps with coarse localization. Grad-CAM highlights the regions of interest that the model focuses on, while IG localizes the face pattern. Both techniques produce a gradient heatmap to visualize the model’s decision-making. Also, they apply to any model with a CNN structure. In our case, we’d implemented both algorithms using Keras. The details of how these algorithms work will be explained in the next section.
Dataset
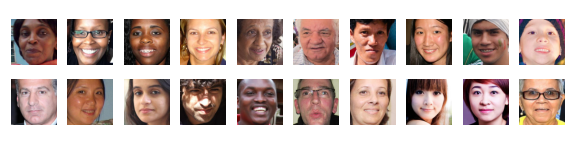
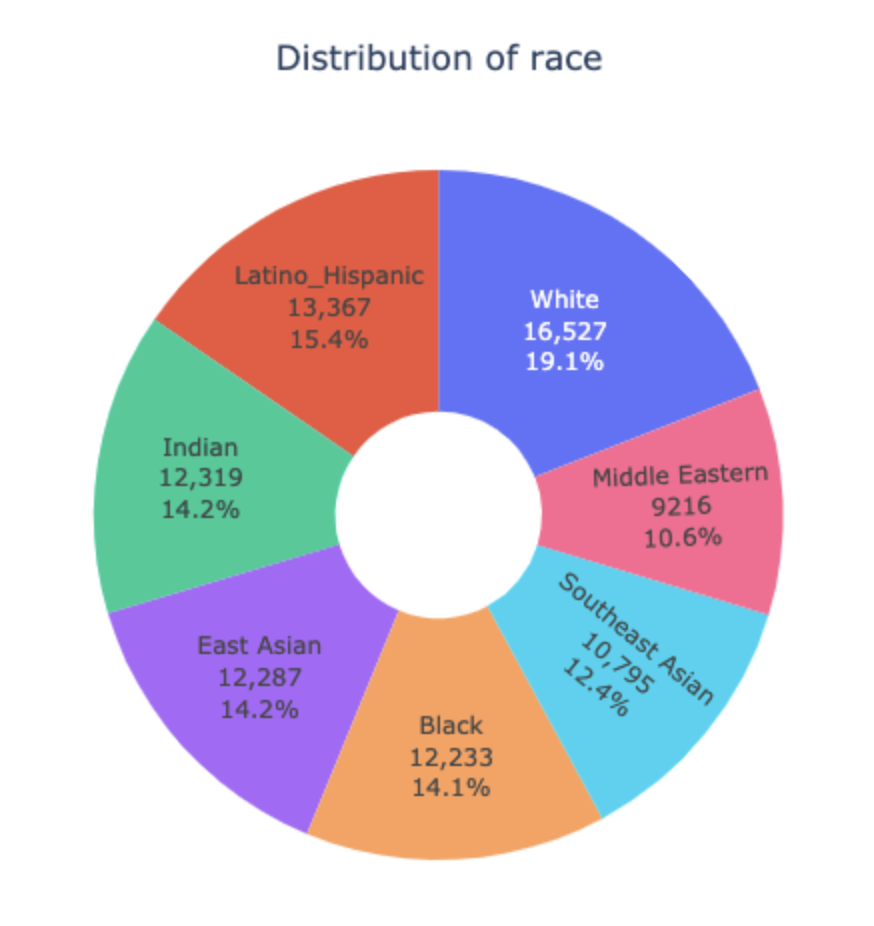
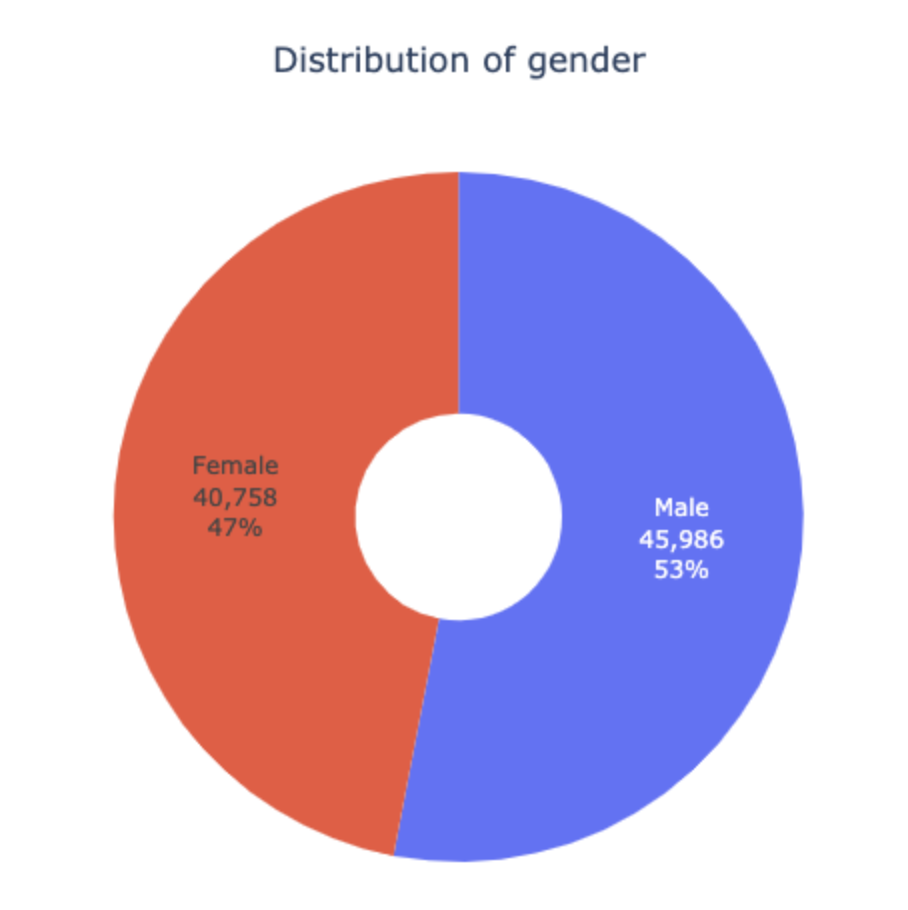
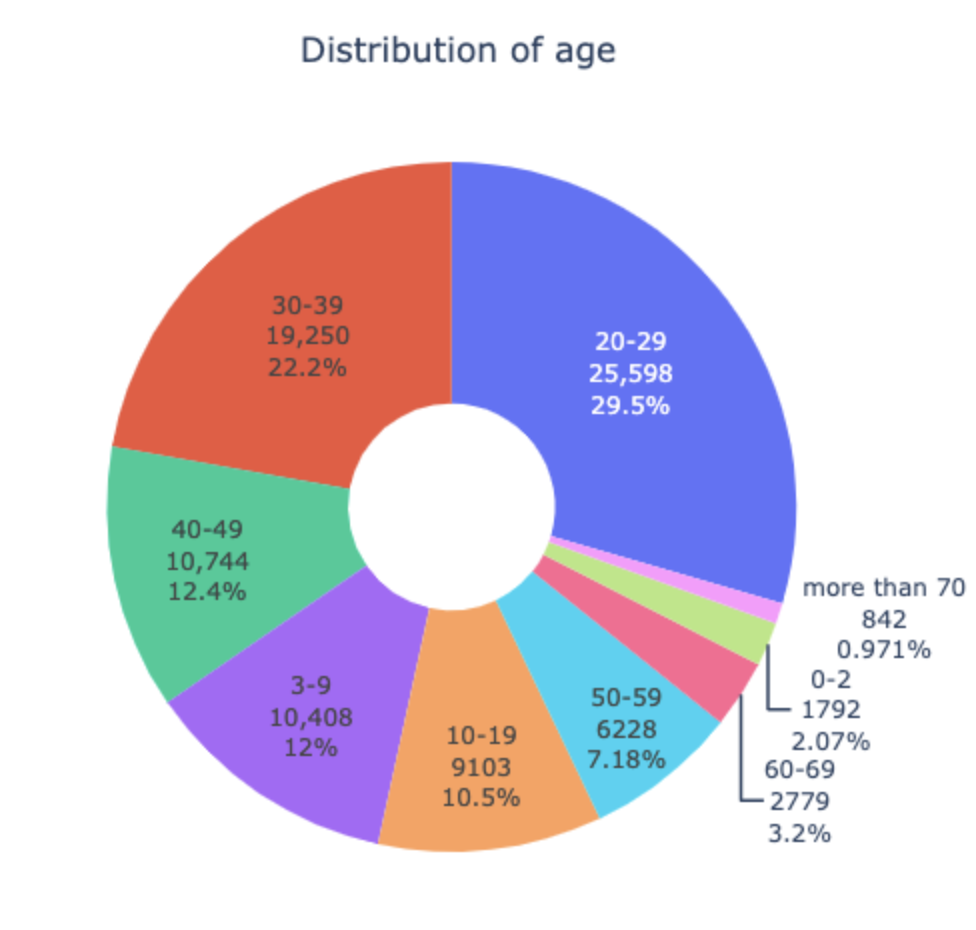
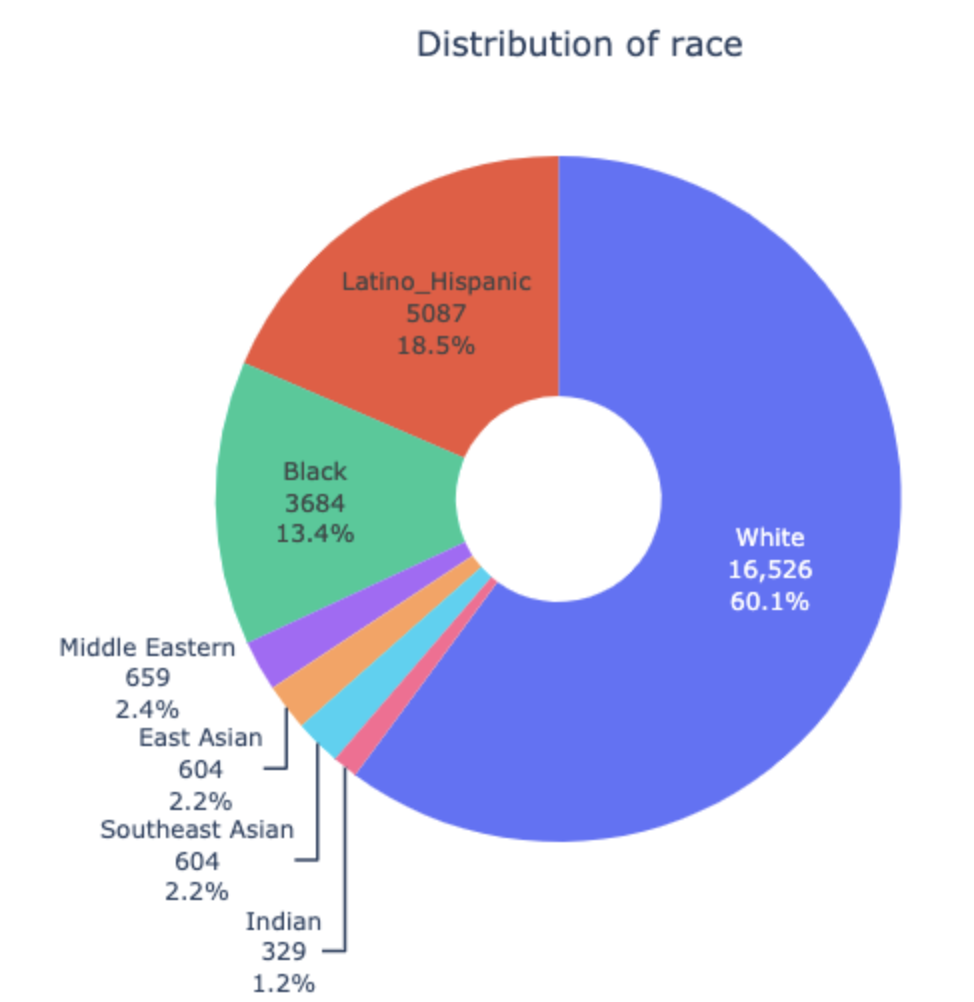
Our project uses the FairFace dataset to perform classification and analysis. FairFace supplies 100000+ images of faces from an equally distributed pool of seven race categories, two genders, and eight age groups. In addition to being uniquely comprehensive and applicable to our project, the size of this dataset allows us to create subsets of the data in order to display biased training sets. The biased data was generated based on the actual US population as recorded in the 2019 US Census dataset.
FairFace(unbiased) dataset distribution
Note: What we mean by "unbiased" only applies to race and gender cateogries.
Biased dataset distribution
XAI Algorithms
Grad-CAM
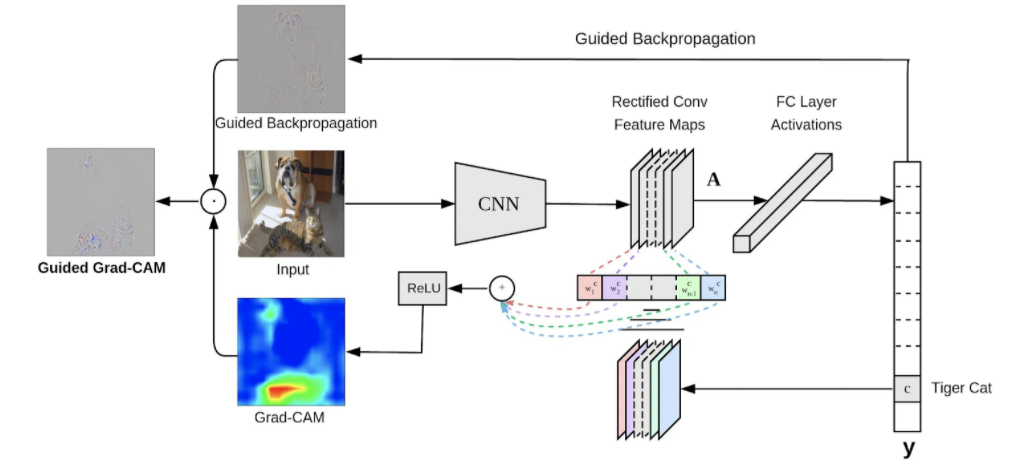
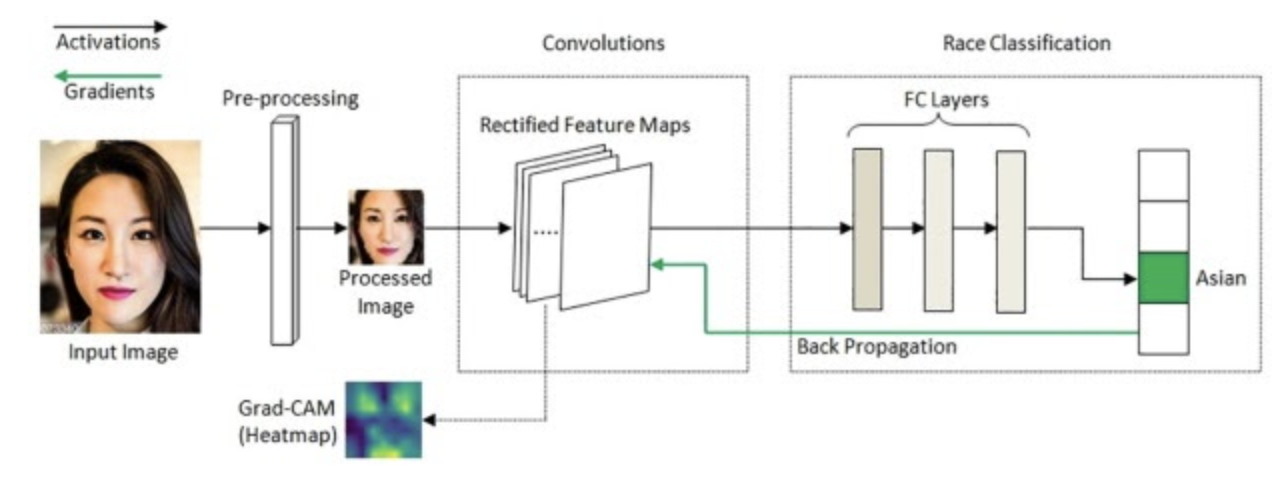
The Grad-CAM algorithm focuses on the feature maps from the final convolutional layer in the neural network. This last convolutional layer would store the most detailed spatial and semantic information about the features of the input image. Then, the feature maps produced from this layer are fed into the fully connected layers that add weights to the features to get the probabilities for each class. The class with the highest probability is chosen as the classification/prediction y for the input image. The calculation steps for the Grad-CAM is the following:
- Compute the gradient of the prediction y (raw score) with respect to the feature maps generated from the final convolutional layer.
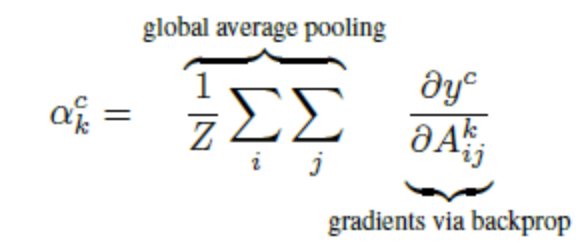
- The feature maps from the final convolutional layer are weighted using “alpha values” which are calculated by averaging the gradients using Global Average Pooling. These weights represent the importance weight of a feature map k to the target class c.
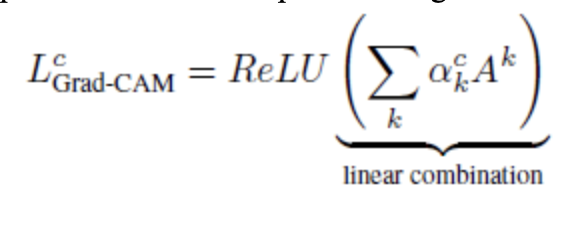
- Calculate the Grad-CAM heatmap by calculating the weighted combination of the feature maps with its weights. The ReLU function is applied to put more importance on the positive values and replace the negative values with 0.
Then, the heatmap resulting from this Grad-CAM procedure needs to be resized to match the dimensions of the input image so that it can overlay on top of it to return the final visualization. The first diagram shows the general process of applying Grad-CAM to a CNN architecture. The second diagram shows how the Grad-CAM algorithm can be applied to a that is trained specifically for racial classification.
Integrated-Gradient
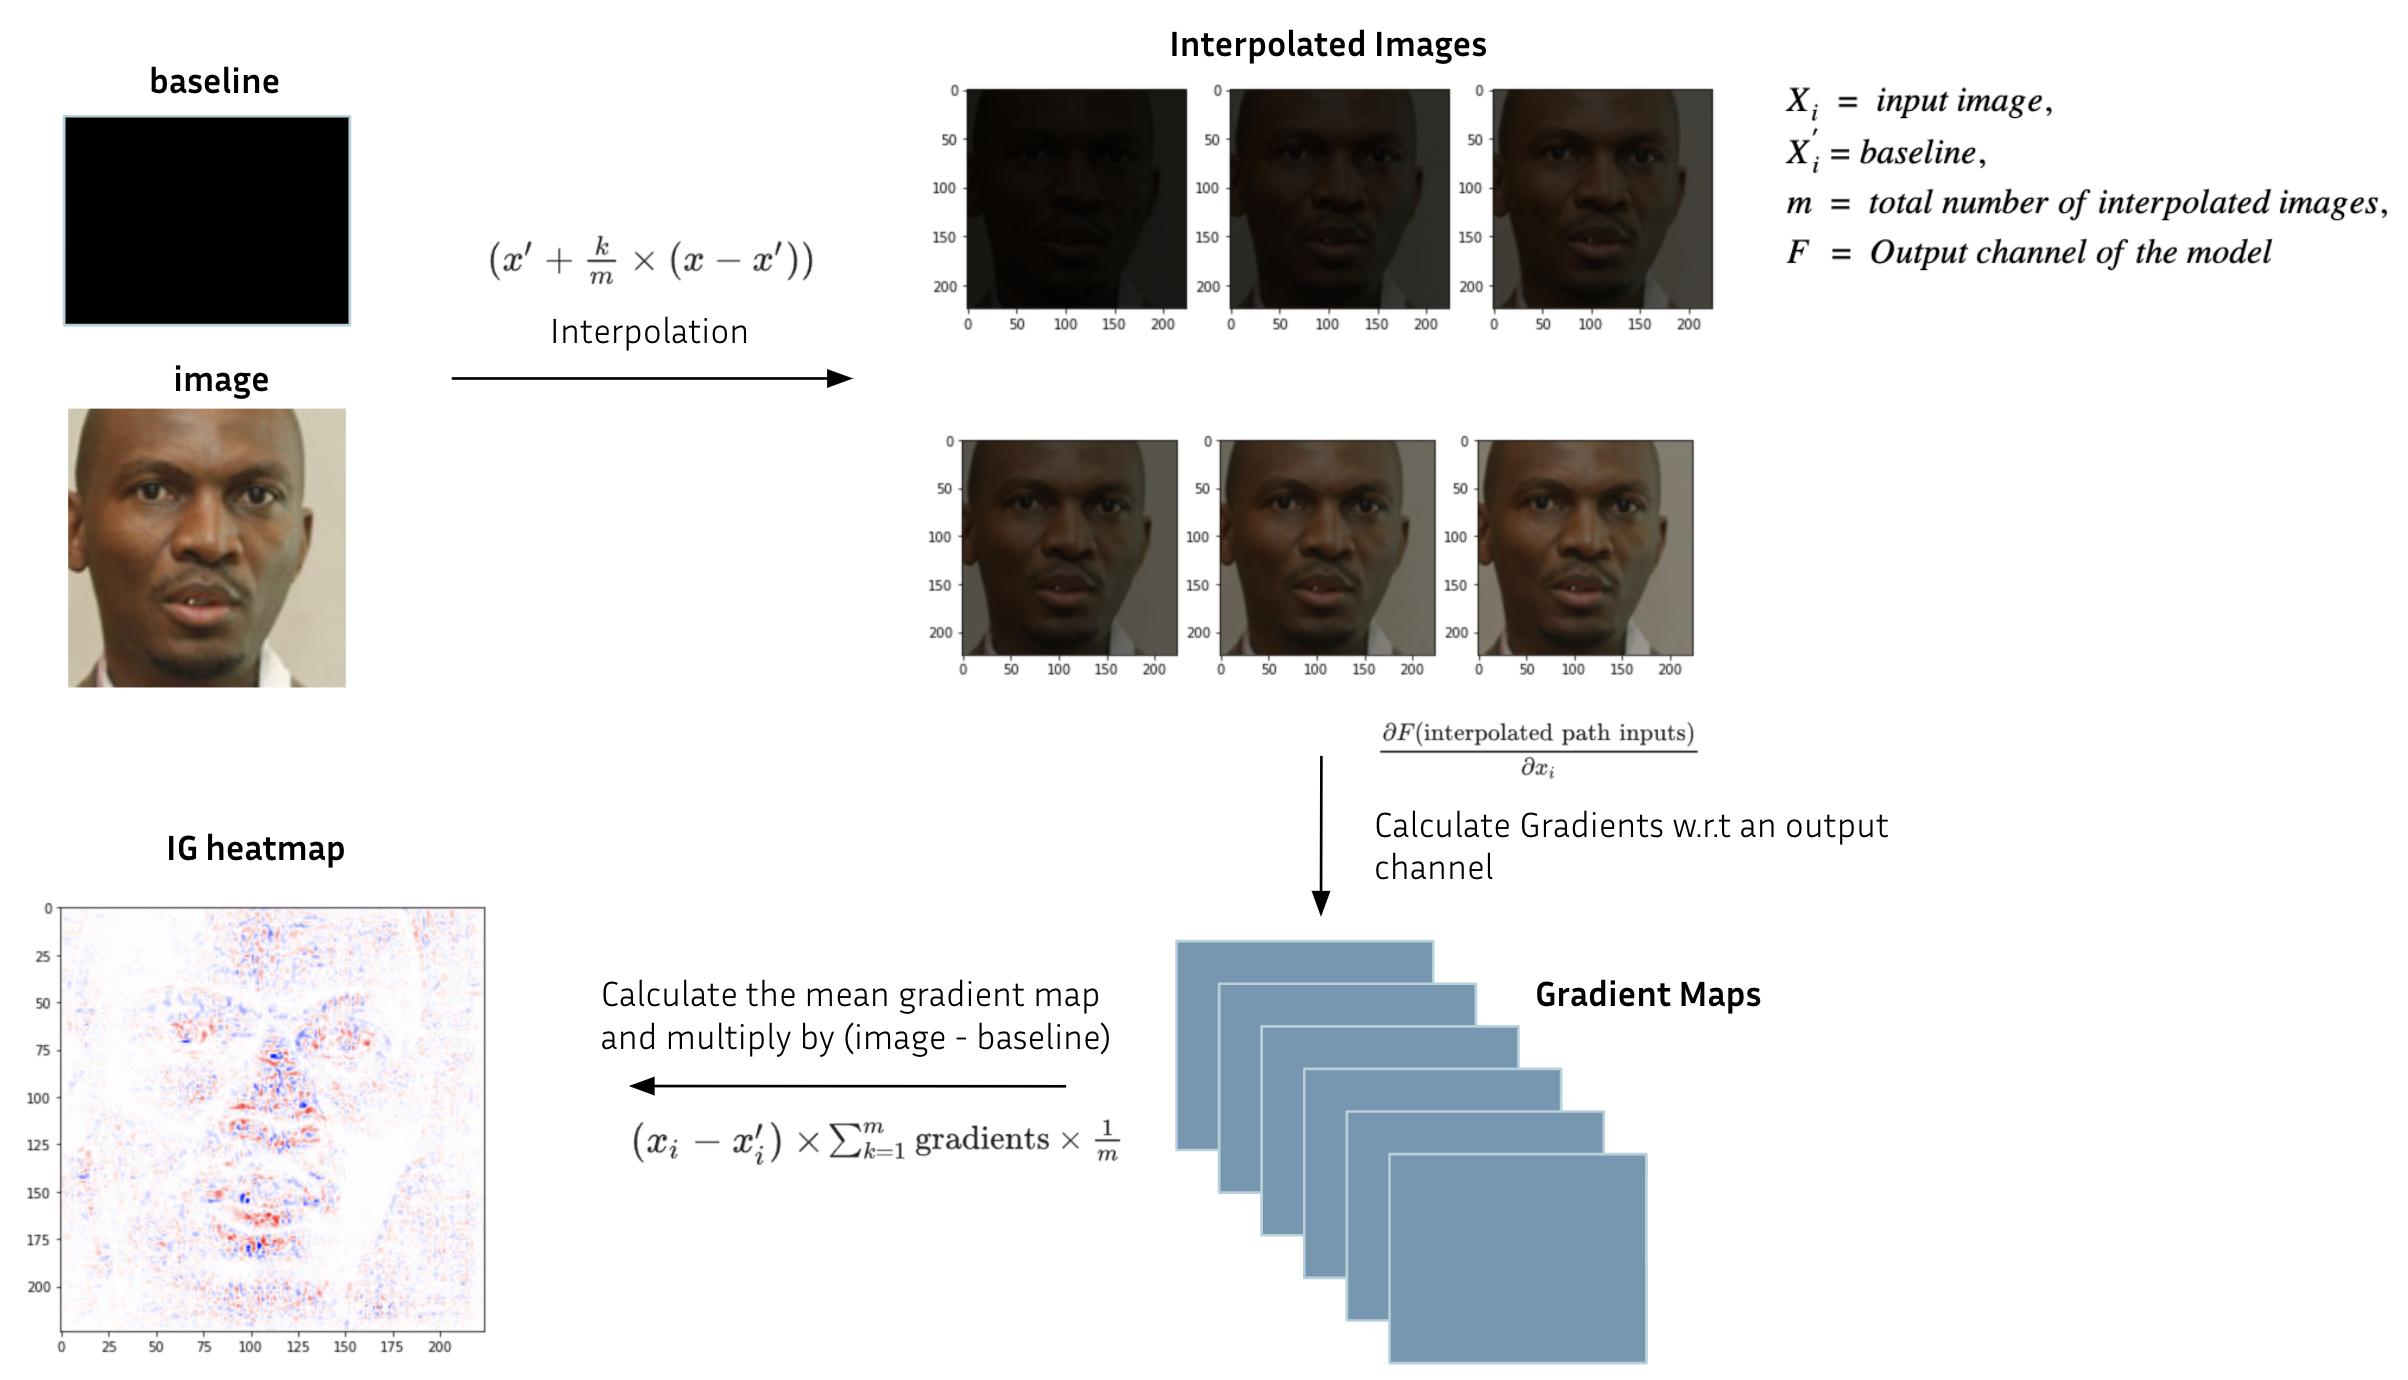
Integrated-Gradient (IG) explains the relationship between the predictions and the learned features. This equation summarizes integrated gradient:
$$IntegratedGrads_{i}^{approx}(x) = (x_i - x^{'}_{i})\sum_{k=1}^{m}{\partial{F}(x^{'}+{k \over m} \times (x-x^{'})) \over \partial{x_i}}$$
where \(x_{i}\) = input image, \(x^{'}_{i}\) = baseline, \(m\) = total number of intepolated images, \(F\) = ouput channel of the model
- Determine \(m\). The common value of \(m\) is >= 20 in practice.
- Generate interpolated images = \(x^{'}+{k \over m} \times (x-x^{'})\)
- Compute gradient between model F output predictions w.r.t features = \({\partial{interpolated \, path \, inputs} \over \partial{x_{i}}}\)
- Integral approximation through averaging gradients = \(\sum_{k=1}^{m}{gradients \times {1 \over m}}\)
- Scale integrated gradients w.r.t input image = \((x_{i} - x_{i}^{'}) \times integrated \, gradients\). The reason this step is necessary is to make sure that the attribution values accumulated across multiple interpolated images are in the same units and faithfully represent the pixel importances on the input image
Here is the visual way to summarize the steps of integrated gradient:
For more information about integrated gradient, tensorflow offers a great tutorial
Result
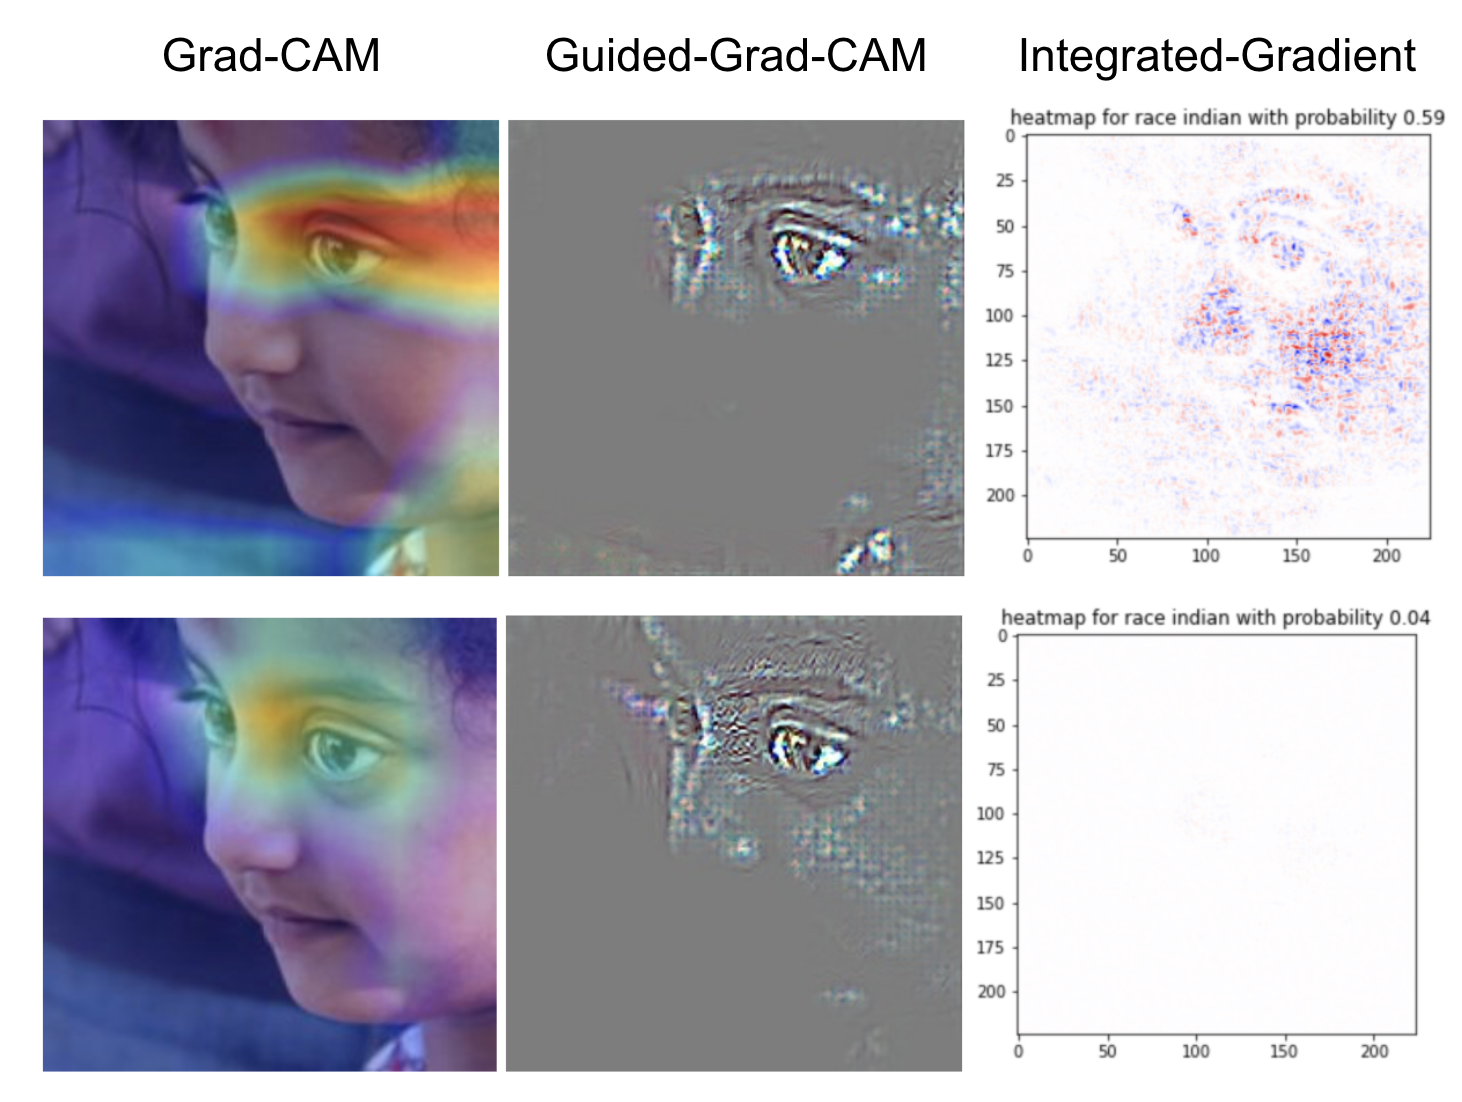
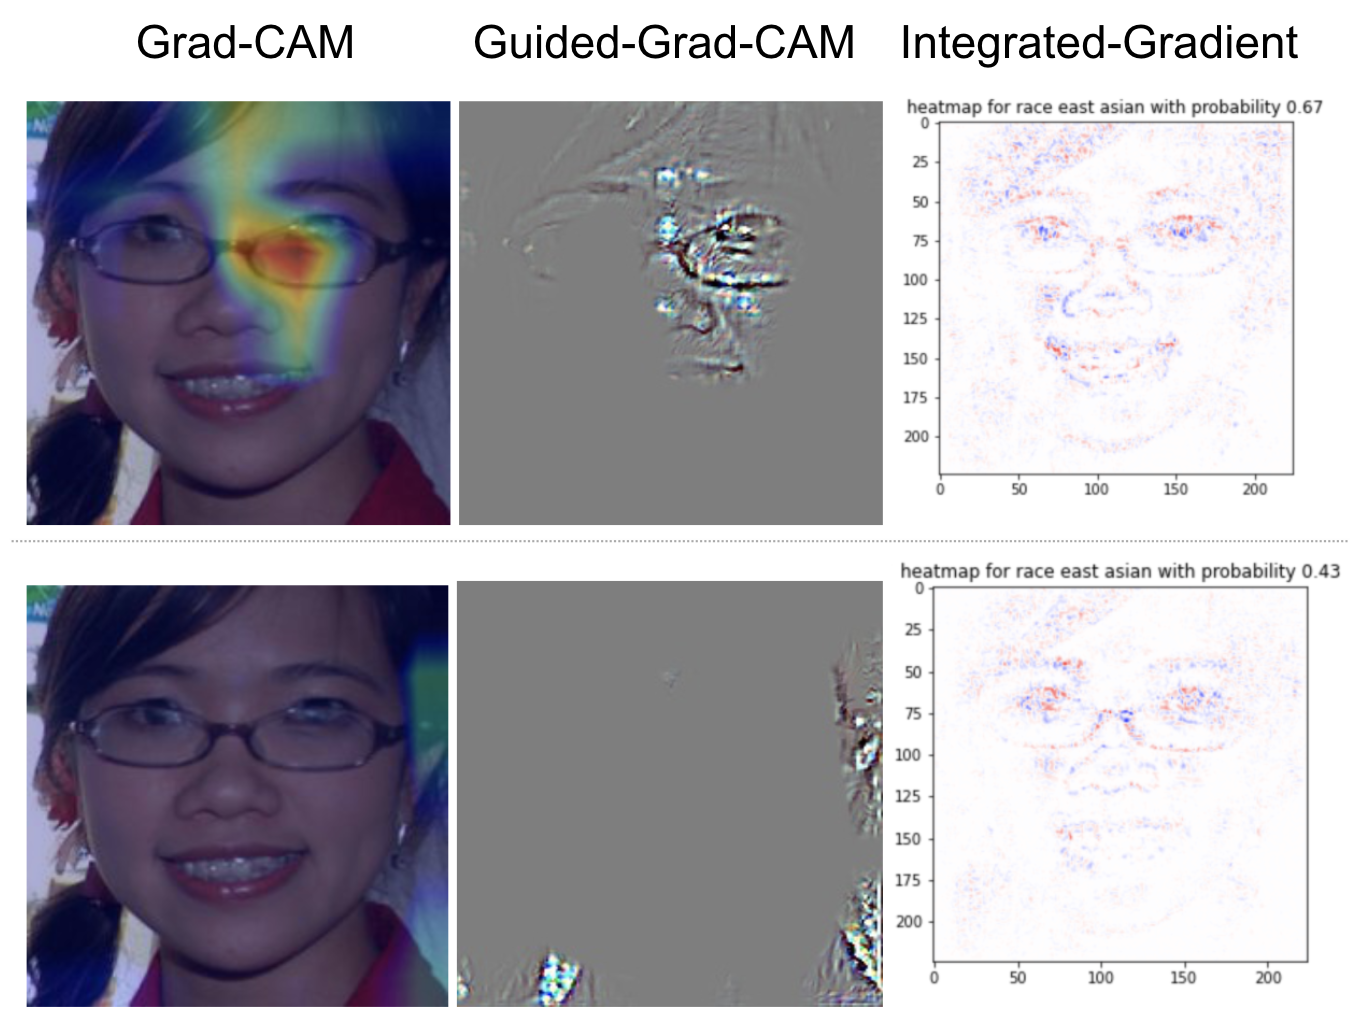
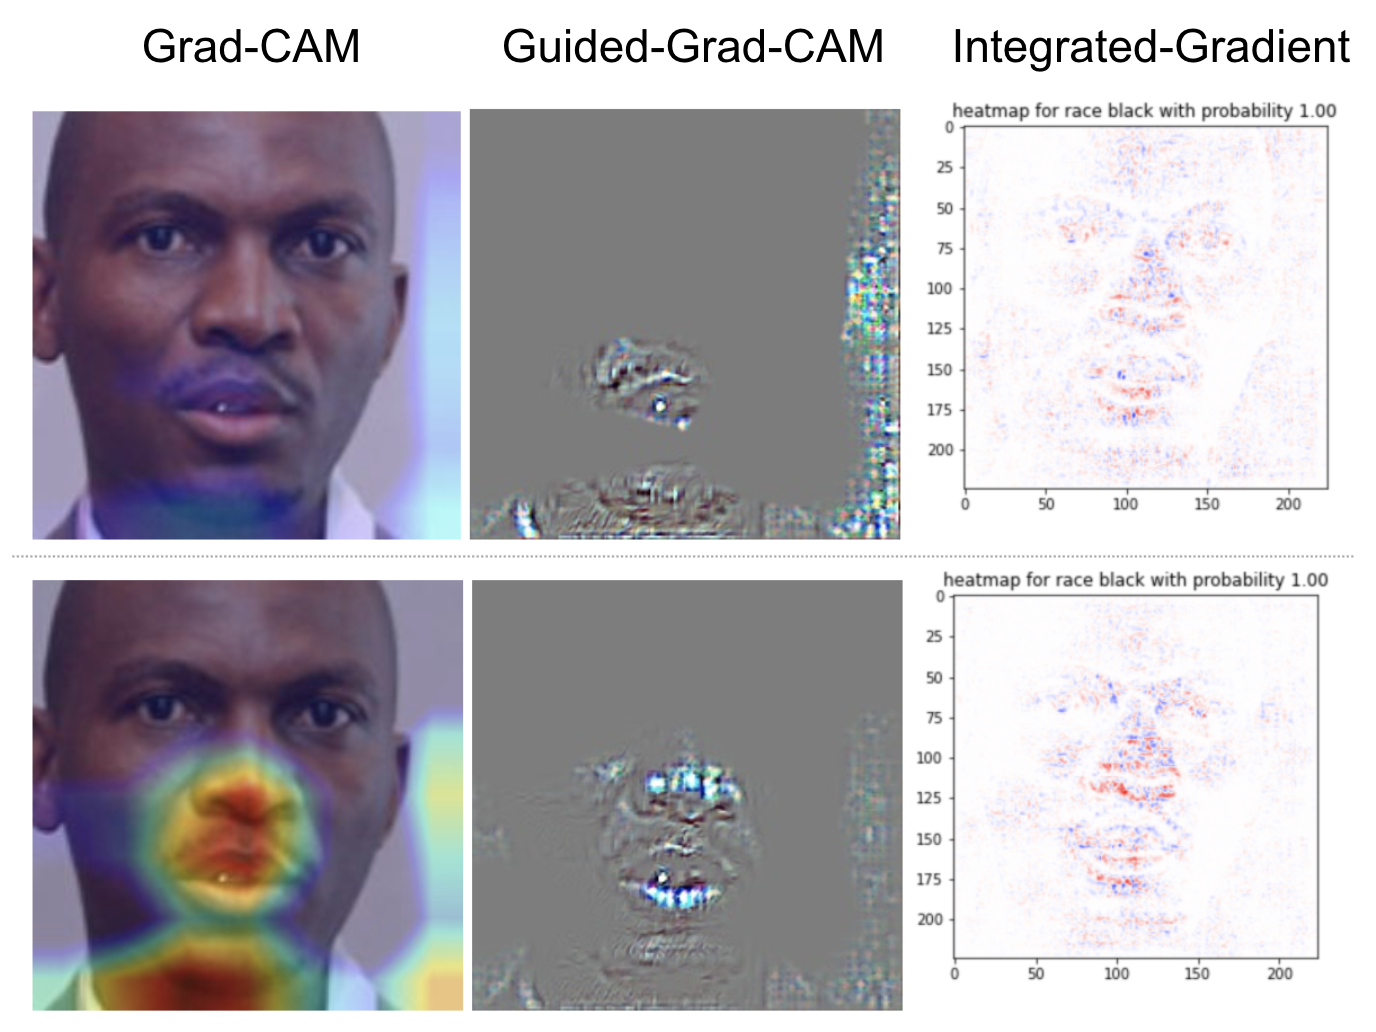
We displayed the heatmaps generated with Grad-CAM and IG for both the fair race model and the biased race model. We selected four samples that include Indian, White, East Asian, and Black people. The heatmaps displayed below are the results. The first row contains the results generated with the fair model, the second row contains results generated with the biasesd model. We will not discuss Guided-Grad-CAM because it is just an alternative visualization of Grad-CAM.
The image is a young Indian girl. The fair model predicted the race correctly as Indian, but the biased model predicted Latino Hispanic. In this example, the Grad-CAM results for the fair model show a strong focus on the eye region, and the biased model covers a similar region, but the activation is not as strong. The IG result for the fair model shows a robust face localization, and the biased model does not show apparent features captured by the model. The Indian race was underrepresented in the biased dataset, which can be depicted by the biased and unbiased models' performance after applying Grad-CAM and IG.
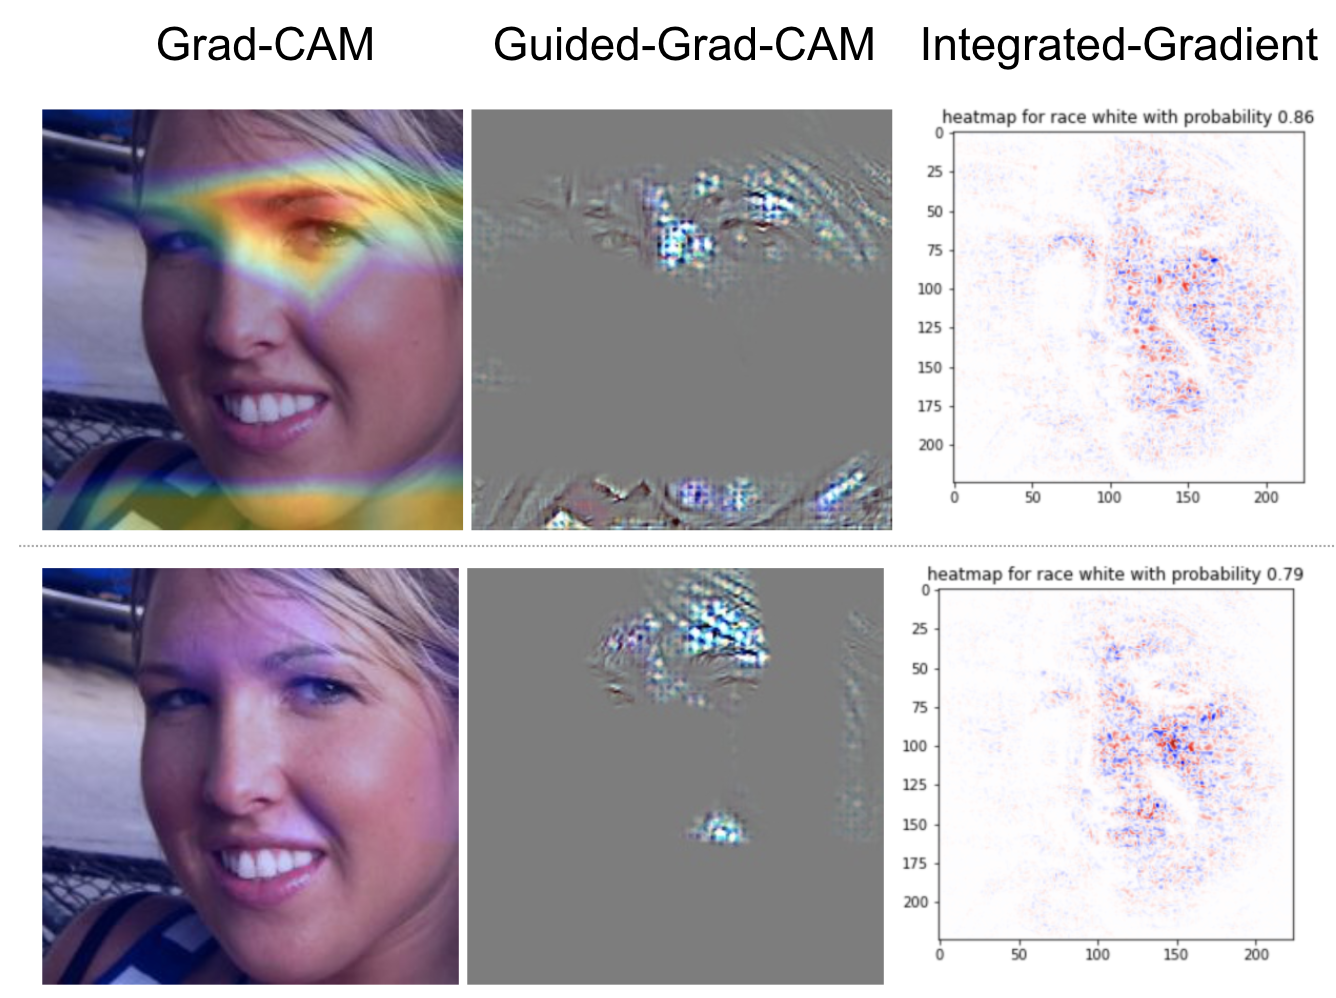
The image is a white lady. The fair model predicted White and shows that the model made its prediction by focusing on the region around the eye. The biased model also predicted White and shows a slight activation in the same eye region. These results depict that the fair model was stronger because it had more robust activation for the highlighted features than the biased model. The White race is over-represented in the biased dataset so could be assumed as a default prediction which led to the model not picking out specific salient features to make its classification. The same reasoning applied to IG. The heatmap generated by the fair model shows stronger activation depicted by the pixel's intensity, but the heatmap generated by the biased model shows clearer face localization, and the face shape is easier to identify. This example shows even when two models make the same prediction, users can use Grad-CAM and IG to distinguish the stronger and weaker model.
The image is a East Asian lady. The Grad-CAM shows that the fair model focuses on the eye's inner region, whereas there are not many activations for any facial features for the biased model. This could explain why the biased model's accuracy for this race is relatively low since it did not learn any specific features to classify this image. The IG heatmaps generated by both models show decent face localization. But the heatmap generated by the fair model has more activation for the face features by showing a more apparent face pattern.
The image is a Black gentleman. The fair and biased model both predicted Black, but in this example, you can see from the Grad-CAM results that the biased model seems to show better results since it shows more robust activation on the face than the fair model. This example shows that the fair model seems to not perform as well for classifying the Black race even though it makes the correct prediction. On the other hand, the biased model successfully picked out features that represented the Black race. However, the IG heatmaps generated by both models display a robust face localization. This example shows that we can utilize different XAI techniques to evaluate the model. Perhaps in the fair model, the model does not show a robust object detection, but by looking at IG heatmaps, we know that the model does localize the face well.
Discussion
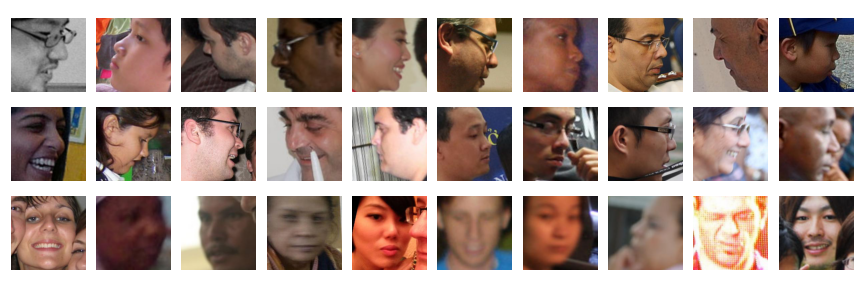
We'd compared the heatmaps generated with the fair race model and the biased race. The Grad-CAM has visualized the important features well, and the Integrated gradient has visualized the face localization well. Overall, the fair race model has better heatmaps representation. We are aware that we only show the four heatmaps samples. We did not find a solution to calculate the aggregate heatmap for each class(e.g., White people's heatmap). The reason is that the face from each image is located at a different place. Therefore, calculating the aggregate heatmap would not make sense. In the future, we will find a solution to align each image's face to the same location so that the aggregate heatmap can be calculated. Also, we will consider coming up with a metric score to evaluate the heatmaps. Another issue that we'd encountered is the training data quality. In the FairFace dataset, some images have faces facing sideways, and some images have poor resolution. We displayed some poor images from the dataset below. The first two rows include images with face facing sideways, and the last row contains images that either has poor resolution or have multiple faces. Our models are susceptible to make wrong predictions for those images, and this indirectly influences the quality of the heatmaps generated by XAI techniques. We should clean the dataset so that the models are trained with high-quality data and can yield higher accuracy for model predictions and better heatmaps visualization.
Conlusion
Improving the model’s explainability is a crucial step to understand AI. We trained CNN models and visualized the heatmaps for input images using Grad-CAM and Integrated-Gradient algorithms. We compared the fair race model and the biased race model's heatmaps and showed that the fair race model could capture more salient features through the heatmaps visualization. This project demonstrates the importance of having an unbiased dataset beforehand and possible unintentional caveat to developing a biased model if the dataset is not ideal.